728x90
import matplotlib.pyplot as plt
from sklearn.datasets import load_iris
import numpy as np
import pandas as pd
import matplotlib.pyplot as plt
import math

# 확률밀도함수 := likelihood
def likelihood(x, u, s):
    p = 1 / math.sqrt( 2 * math.pi * math.pow( s, 2 )) * math.exp( - math.pow( x - u, 2) / ( 2 * math.pow( s, 2) ) )
    return p

# 데이터 불러오기
iris = load_iris()
iris_X, iris_y = iris.data, iris.target # type: ignore
feature_names = iris.feature_names # type: ignore
species = iris.target_names # type: ignore

# save as DataFrame
df = pd.DataFrame()
for idx, feature in enumerate(feature_names):
    df[feature] = iris_X[:,idx]
df['target'] = iris_y

prior_prob = [1/3, 1/3, 1/3]

# set test data
test_idx = 120
test_data = df.iloc[test_idx,:]
# test_posterior_prob = [1.0 for _ in range(len(species))]
test_posterior_prob = prior_prob
# 1.0: float

# matplot
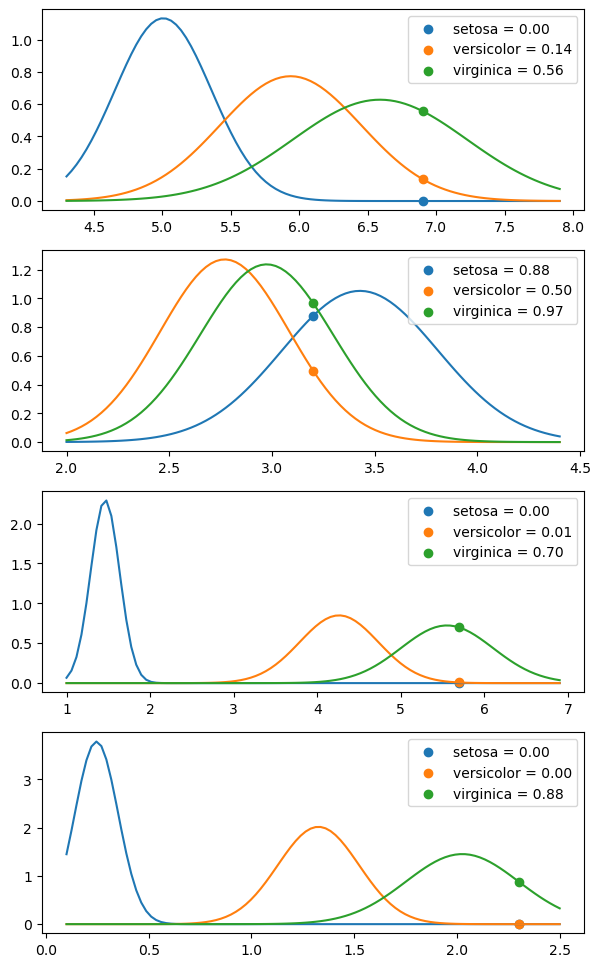
fig, axes = plt.subplots(len(feature_names), 1, figsize=(7,12))
for idx_feature, ax in enumerate(axes.flat):
    x_lin = np.linspace(df.iloc[:,idx_feature].min(), df.iloc[:,idx_feature].max(), 100)

    for idx_class, name_class in enumerate(species):
        x = df[df.iloc[:,-1]==idx_class].iloc[:,idx_feature]
        x_mean, x_std = x.mean(), x.std()

        ax.plot(x_lin, [likelihood(x, x_mean, x_std) for x in x_lin]) # type: ignore

        test_x = test_data.iloc[idx_feature]
        test_y = likelihood(test_x, x_mean, x_std)

        ax.scatter(test_x, test_y, label=f'{name_class} = {test_y:.2f}') # type: ignore
        ax.legend() # type: ignore

        test_posterior_prob[idx_class] *= test_y

print(f'Class of Test data : {species[np.argmax(test_posterior_prob)]}')

728x90
'새싹 > TIL' 카테고리의 다른 글
| [핀테커스] 231019 Bayes Theorem - 실습 (0) | 2023.10.20 |
|---|---|
| [핀테커스] 231011 KNN (0) | 2023.10.11 |
| [핀테커스] 231010 KNN 구현 (0) | 2023.10.10 |
| [핀테커스] 231006 matplot - iris (0) | 2023.10.06 |
| [핀테커스] 231005 matplot 실습 (0) | 2023.10.05 |